
SMART SURFACES TOOLS
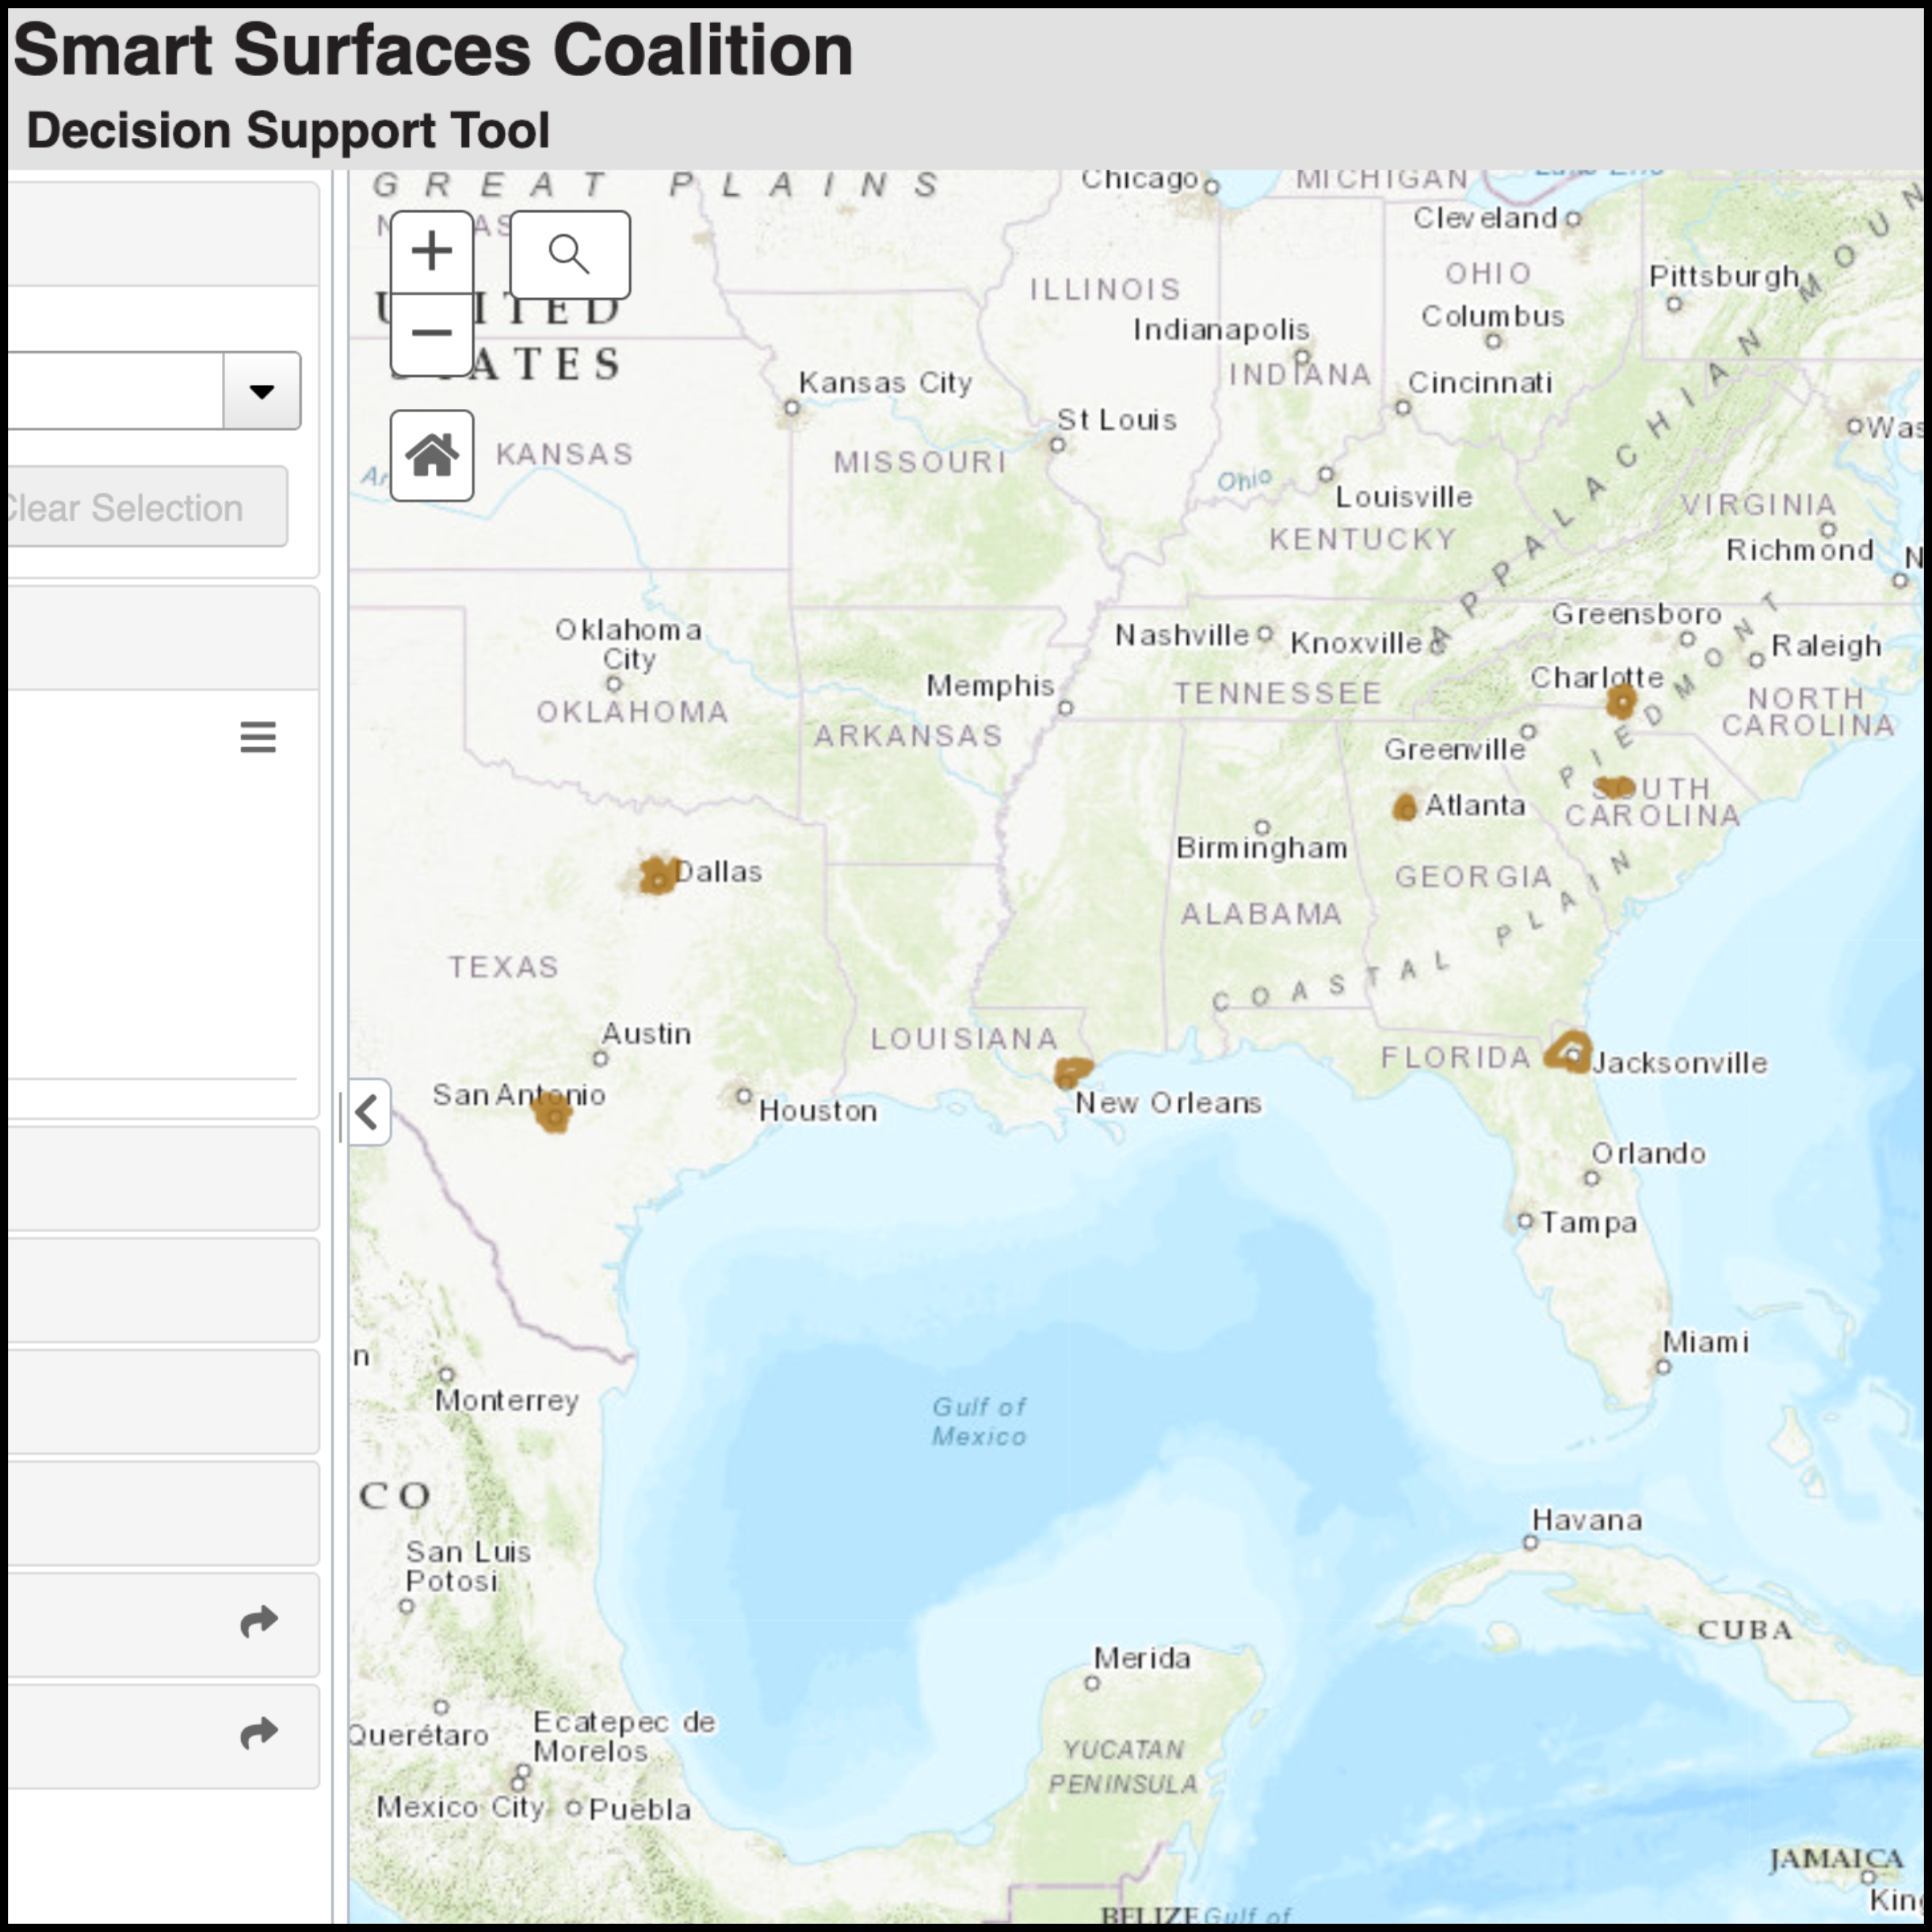
decision support tool
The DST enables decision makers and community stakeholders to identify priority sites for Smart Surface implementation based on a wide variety of data layers.
smart surfaces policy tracker
An interactive policy tracker that enables cities explore, compare, and adapt Smart Surfaces regulations from peers across the U.S.
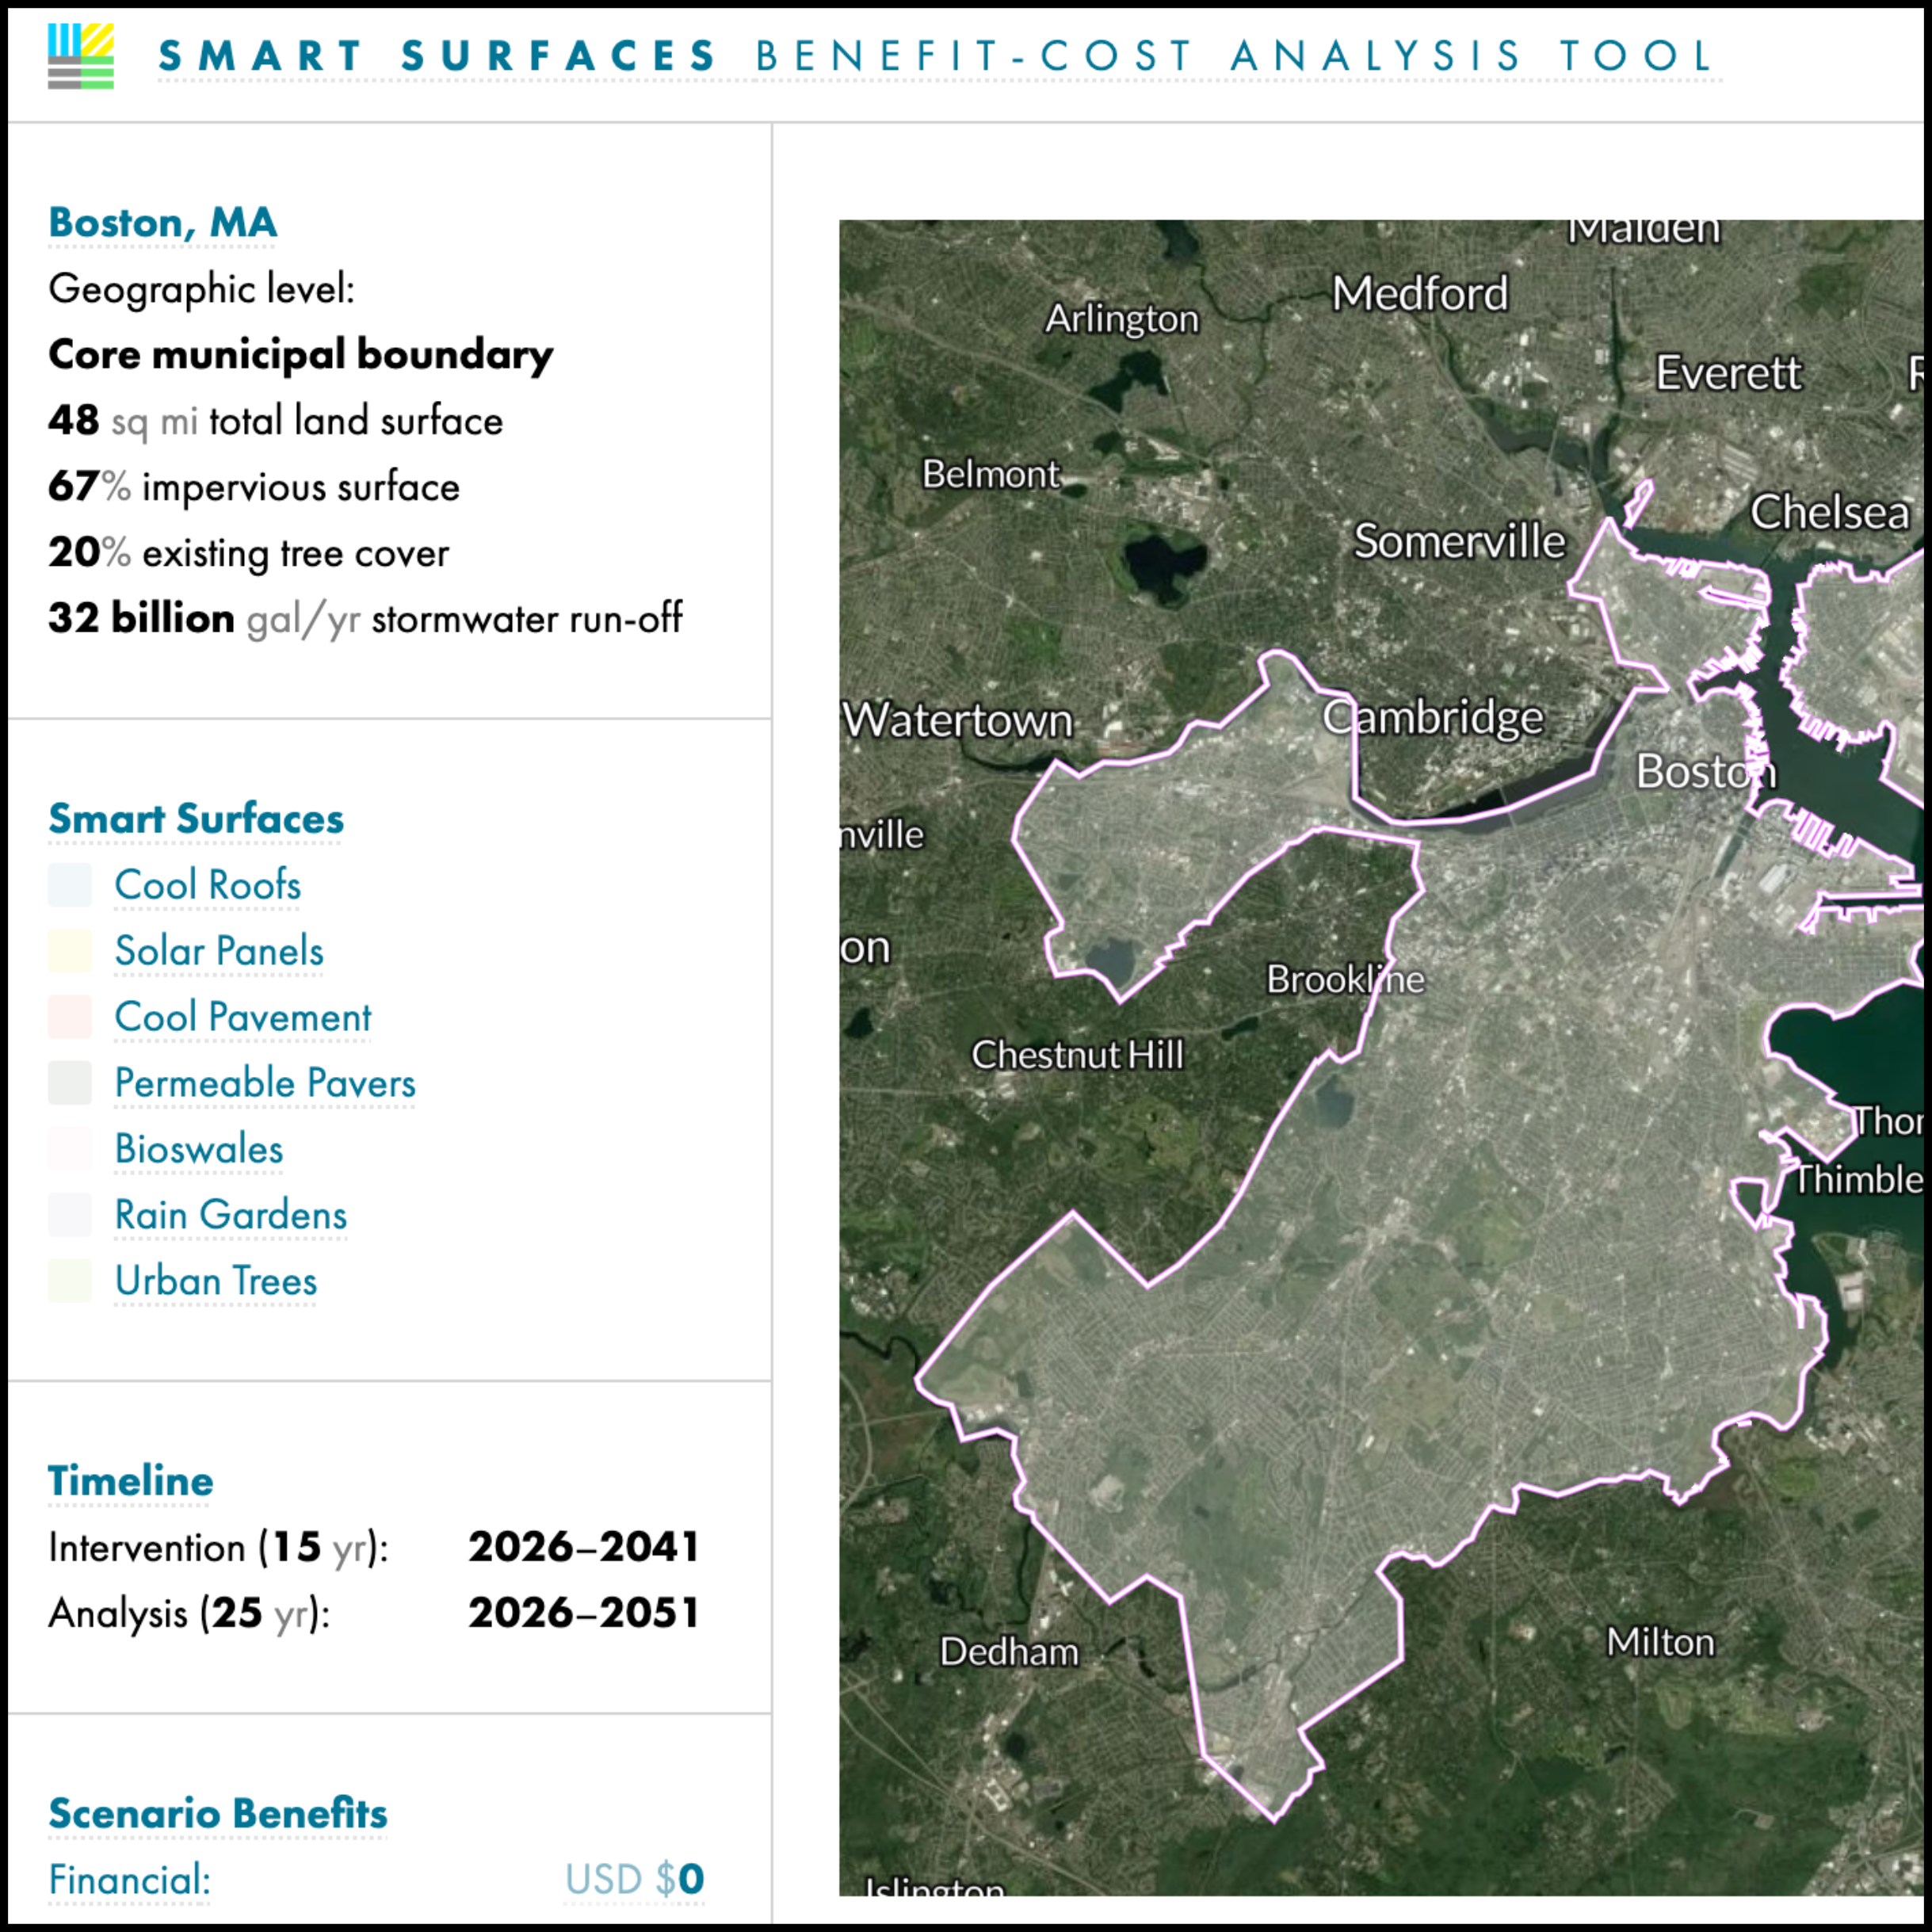
benefit-cost analysis tool
The BCAT enables cities quickly identify the most cost-effective surface changes to improve resilience, cool neighborhoods, create jobs, and protect public health.
where do i begin?
-
Begin with the geospatial Decision-Support Tool to identify census tracts that are most exposed to climate hazards, and explore what infrastructure interventions are viable in those areas. Then, identify policy or program language from the Policy Tracker to support infrastructure adoption. Lastly, model the impacts of infrastructure interventions in those areas using the Benefit-Cost Analysis Tool. The tool currently enables city- and metro area-level modeling, and will eventually include neighborhood-scale.
-
Already interested in a particular kind of policy? Find example language from peer cities in the Policy Tracker, or use SSC’s sample language and policy justification memos to design your own policy. From there, use our Benefit-Cost Analysis Tool to model the financial, temperature, and CO2e impacts of that policy using the Benefit-Cost Analysis Tool. Then support your findings with the geospatial Decision Support Tool, where you can identify particular neighborhoods or census tracts that would benefit most from targeted investments / incentives, if city-wide policy is infeasible.
-
Explore the financial, temperature, and CO2e impacts of Smart Surface technologies in varied combinations with the Benefit-Cost Analysis Tool. Run optimization exercises to identify combinations of interventions that best meet your goals. Afterwards, use the Decision-Support Tool to identify census tracts with the greatest potential/greatest need for implementation of those interventions. Then identify policy or program language from the Policy Tracker to support infrastructure adoption.
more tools from our partners

The American Lung Association’s State of the Air Report Cards rank cities and grade counties to determine which are the cleanest versus the most polluted.

American Forests’ Tree Equity Score analyzes various metrics such as tree cover, temperature, income, race, and health to quantify a neighborhood or city’s tree equity.

American Council for an Energy-Efficient Economy’s tool tracks state policies and programs to reduce energy use and scores each state.
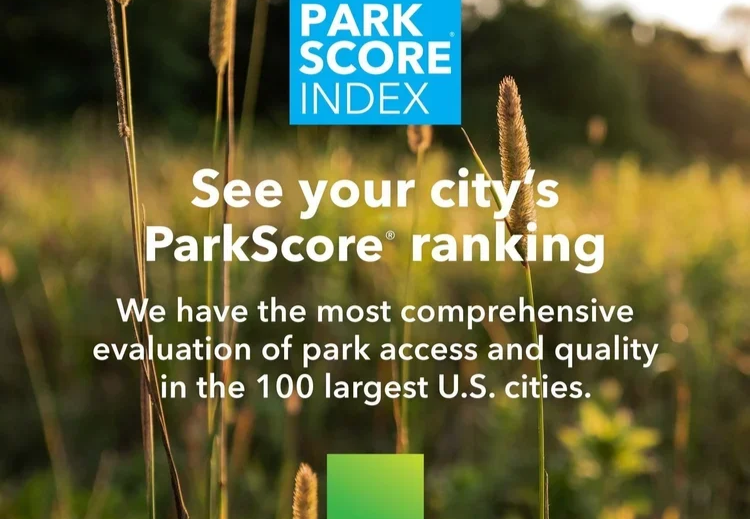
Trust for Public Land's ParkScore index measures park systems annually according to five categories: access, investment, amenities, acreage, and equity.